
- Home
- Surveys & Testing
- Thermal imaging survey
See where the heat actually goes.
Thermal imaging across Chertsey and Surrey, in the months it works: cold outside, warm inside.
What the camera is showing you
It reads surface temperature, not heat loss directly. That distinction is what separates a useful survey from a pretty picture.
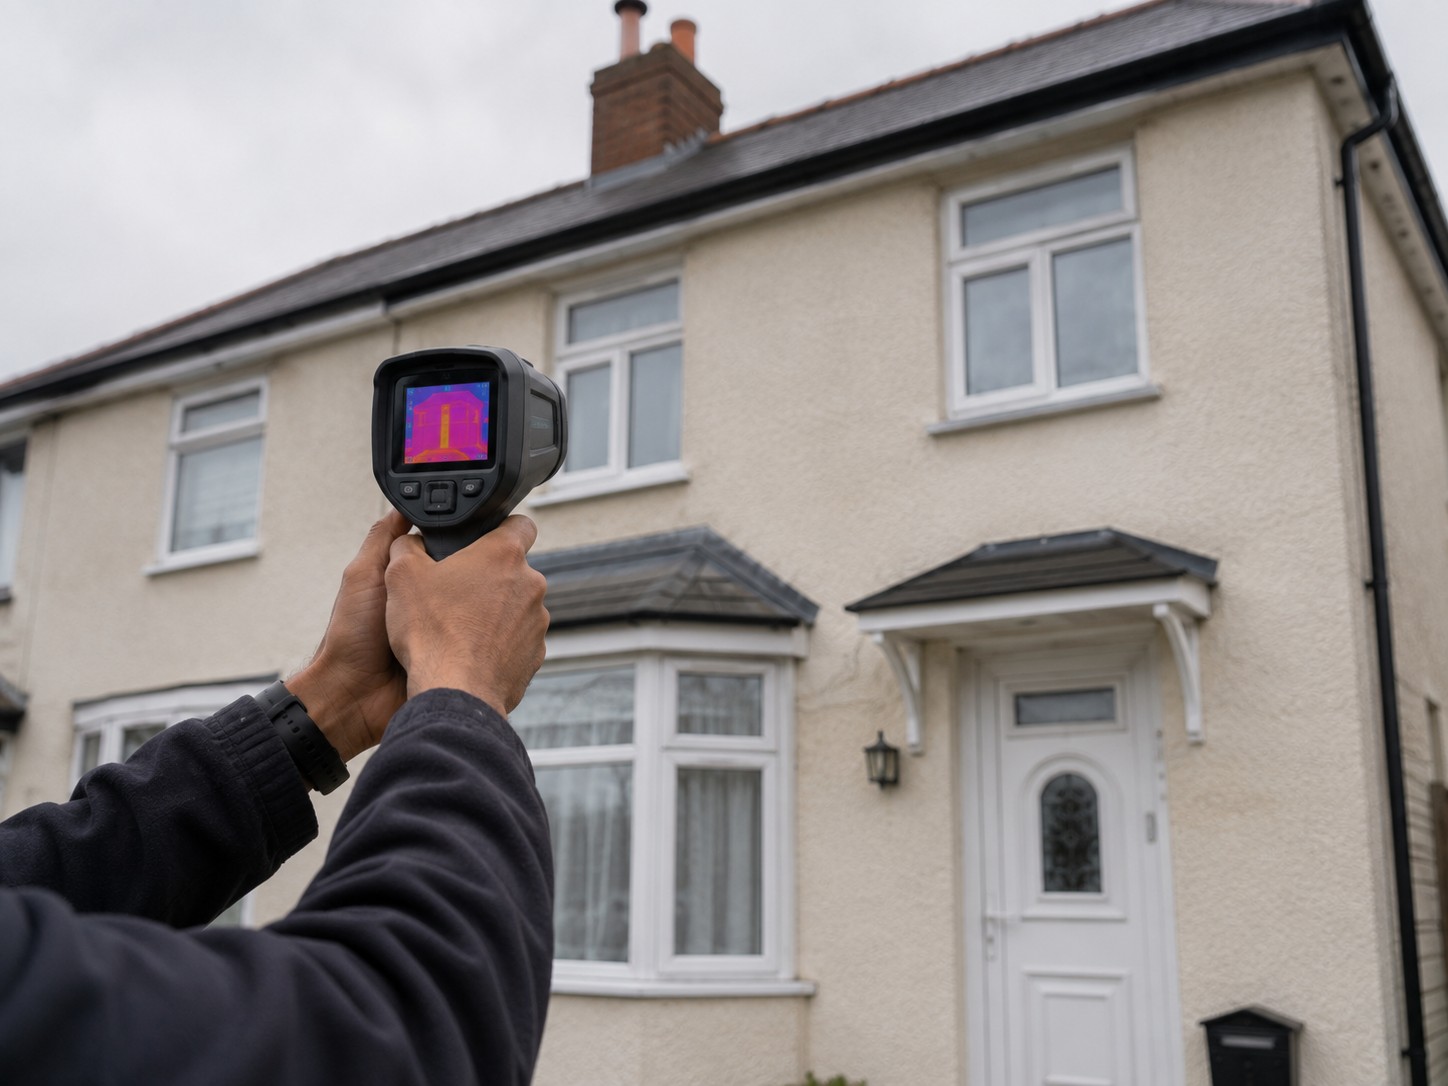
It reads surface temperature
Warm surfaces on the outside mean heat reaching them. Cold surfaces on the inside are where condensation will appear first.
Missing insulation shows as a pattern
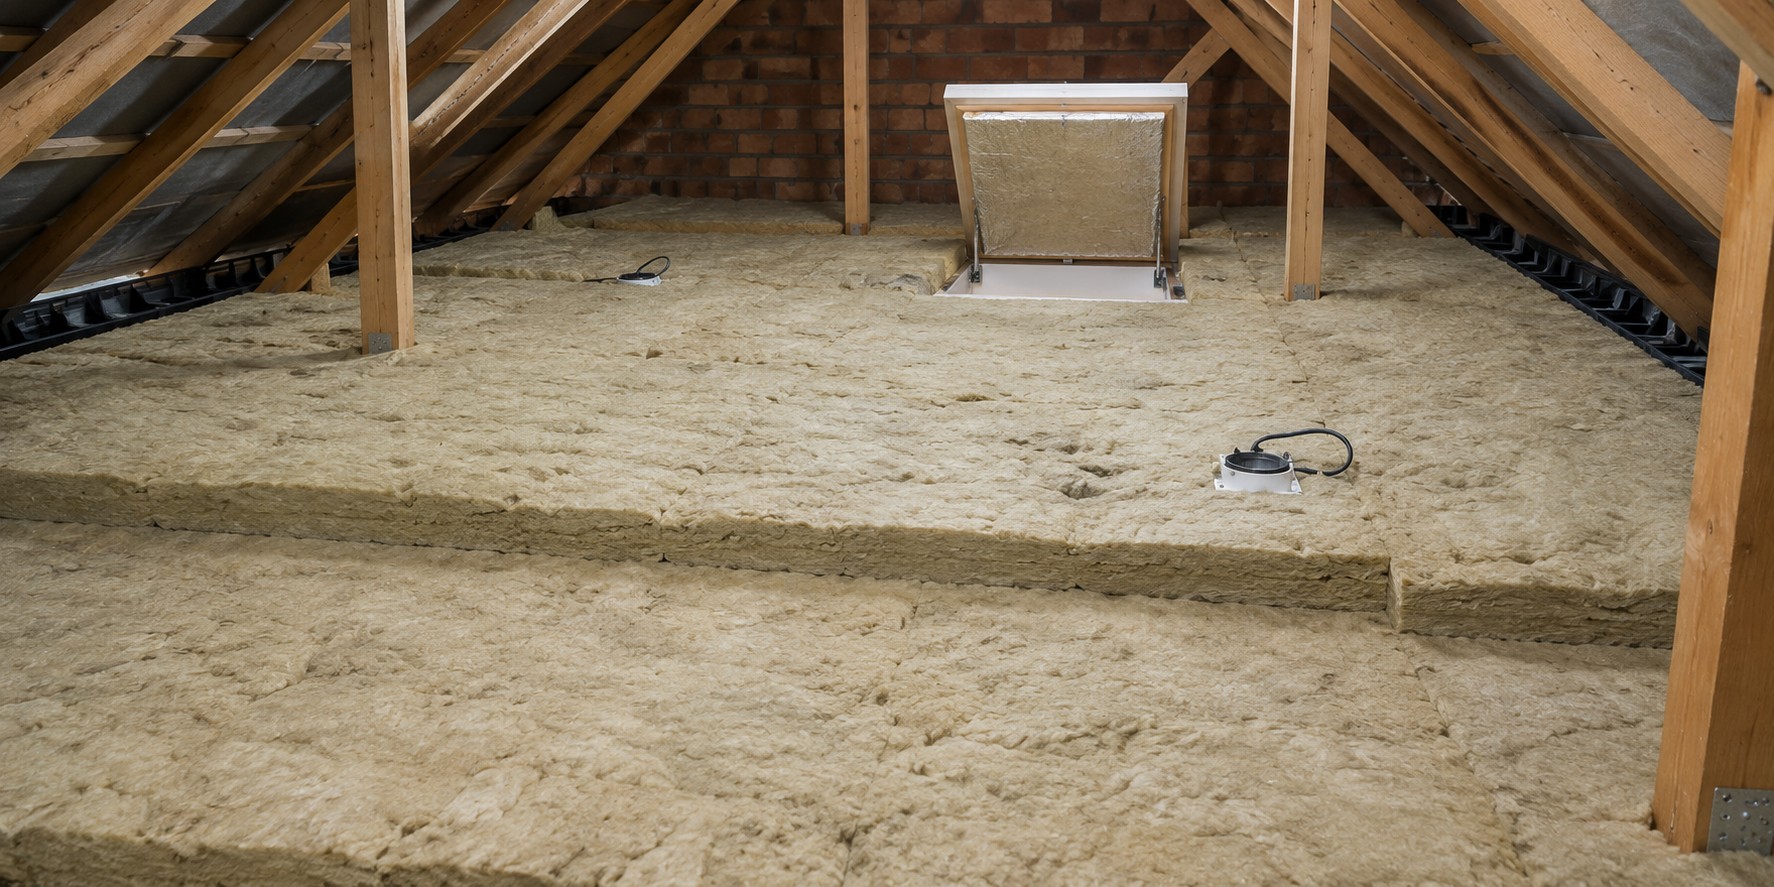
Gaps between insulation batts, slumped cavity fill and uninsulated sections show as regular shapes rather than random warmth.
Cold bridges show as lines
Joists, lintels, wall ties and junctions. Straight lines in a thermal image are almost always structure.
Air leakage shows as plumes
Streaks spreading from a gap rather than a defined shape. Running an air tightness test at the same time makes these obvious.
What it is good and bad at
Being straight about the limits is what makes the good part useful.
- Good at: finding missing insulation
- Gaps, slumping and areas that were never done show up clearly and unarguably.
- Good at: cold bridges and damp risk
- It tells you where condensation will appear before it appears, which is genuinely useful.
- Not a measurement of heat loss
- It shows where, not how much. Quantifying it is what the heat loss calculation is for.
- Needs the right conditions
- A decent temperature difference inside to out, so roughly October to March, and not in direct sun or driving rain.
How it runs
In season
October to March, and we will say so rather than take the booking in July.
Heating on
The house wants to be warm and to have been warm for a few hours before we arrive.
One to two hours
Every elevation outside, and room by room inside, with images captured as evidence.
The report
Annotated images with what each one shows, and what is worth doing about it.
With an air tightness test
Run together, air leakage becomes obvious rather than inferred.
After the report lands
A survey is only worth having if somebody acts on it.
The report, in writing
Findings, readings and recommendations, in a document you keep and can show to anybody else.
We will tell you what not to do
Reports generate lists. We will say which items matter on your property.
Work we then do is guaranteed
Two years on our workmanship, in writing, transferable and insurance-backed.
Questions after the report
The surveyor and the installer are the same company.
Two things people ask about next
Both have a page of their own.
The questions we get asked most
When can you do it?
October to March, when there is enough temperature difference between inside and out. In summer it produces images that look impressive and mean very little.
Does it measure how much heat I am losing?
No. It shows where heat is reaching a surface. Quantifying the loss is what a heat loss calculation does.
Will it find damp?
It finds cold surfaces, which is where condensation forms, and evaporative cooling from wet material shows too. It is an indicator, not a moisture reading.
Do I need to do anything beforehand?
Have the heating on and the house warm for a few hours before we arrive, and move furniture away from external walls where you can.
Can you do it with an air tightness test?
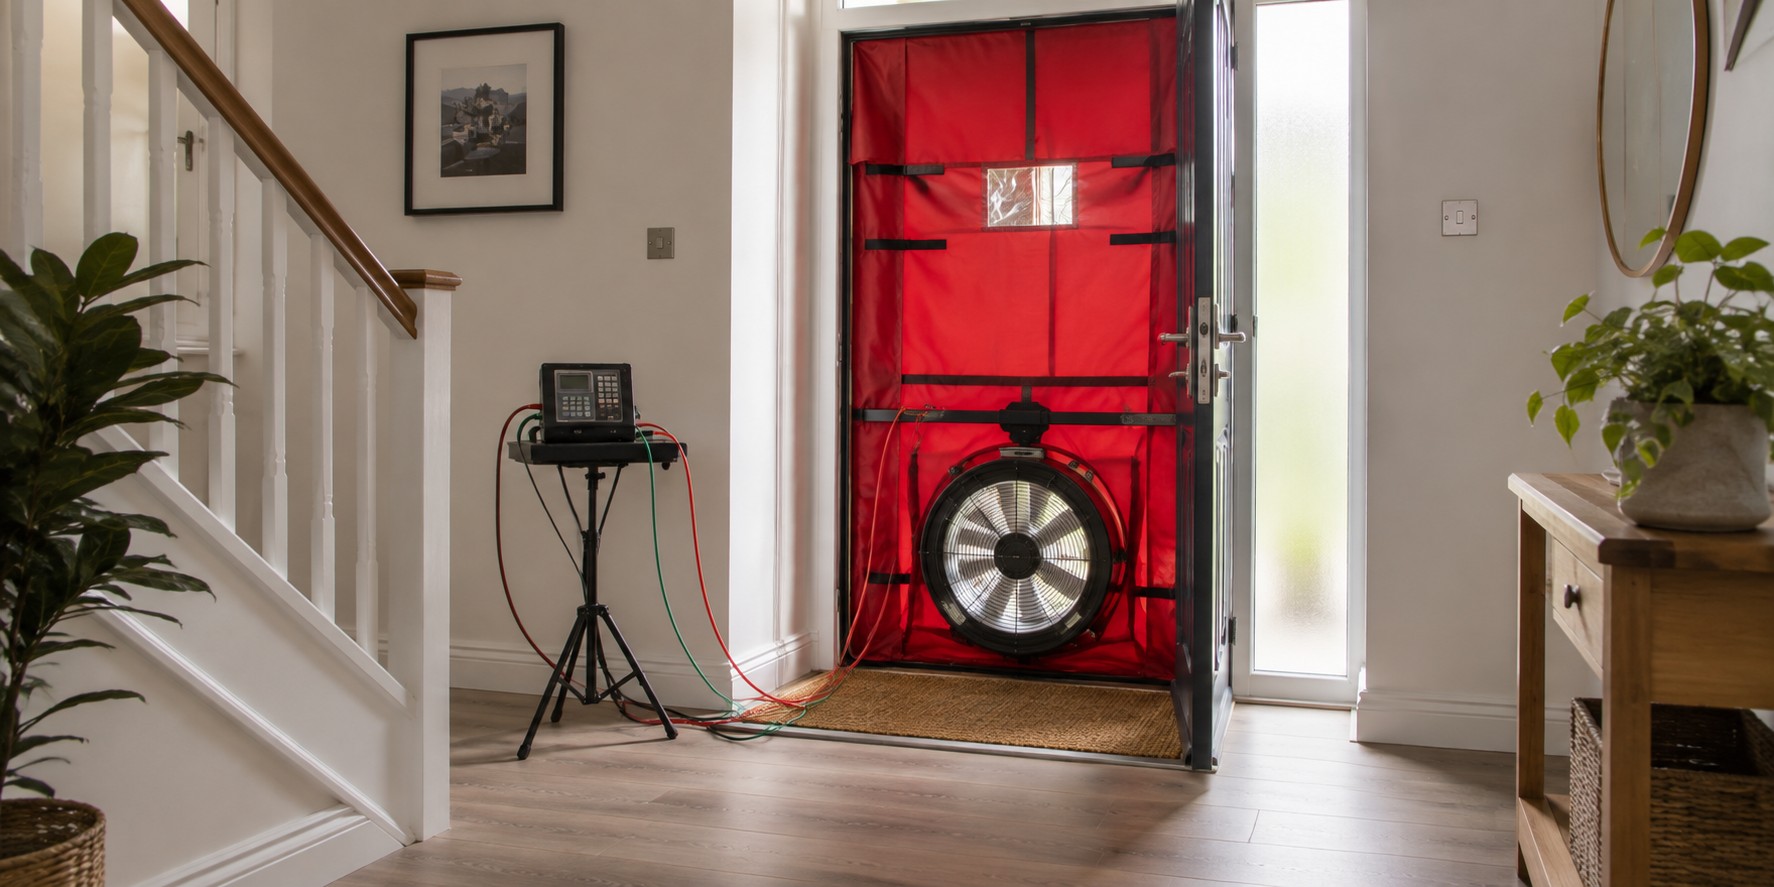
Yes, and it is the best combination. With the fan running, air leakage paths show up clearly.
How long does a thermal imaging survey take?
One to two hours at the property, and an annotated report follows.
















Often worth doing at the same time
Same team, same survey, one visit where it makes sense.
Book a thermal imaging survey
October to March, when there is enough temperature difference for the images to mean anything.
- A fixed price, confirmed before we book
- An annotated report showing what each image is
- Best value run alongside an air tightness test
- Weekdays 8am to 5pm, on 01932 550828
Book it in the cold months.
October to March, one to two hours, and an annotated report showing exactly where the heat is going.